US 2024 -> Models -> Prospective
Predicting elections from the most important issue
- The big-issue model predicts U.S. Presidential Election outcomes based on polling data regarding voters‘ expectations on the most crucial issue facing the country.
- Offers a straightforward and easily understandable model with implications for political candidates.
- Demonstrated competitive accuracy in ex-ante forecasts for the three elections from 2012 to 2020
Methodology
The model employs a straightforward decision rule encompassing three fundamental steps to forecast the election winner:
- Issue Identification:
- Pinpoint the issue perceived as most important by voters.
- Voter Support Calculation:
- Calculate the two-party shares of voter support for candidates on this identified issue.
- Election Winner Prediction:
- Predict the candidate with higher voter support to emerge as the winner in the popular vote.
Simple linear regression is then used to relate the incumbent party candidate’s rolling average (calculated by using exponential smoothing) of voter support on the most important issue (BI) to the dependent variable, which is the actual two-party popular vote share received by the candidate of the incumbent party (V). Using data from the last forecasts prior to Election Day in the thirteen elections from 1972 to 2020 leads to the following vote equation: V=25.4+54.5×BI
That is, the big-issue model predicts that an incumbent would start with 25.4% of the vote, plus a share depending on BI. For example, if the incumbent’s voter support on the most important issue went up by 10 percentage points, the incumbent’s vote share would go up by roughly 5.5 percentage points.
Simple model with decision-making implications
The Big-Issue model, crafted by PollyVote’s Andreas Graefe and Scott Armstrong, forecasts U.S. Presidential Election outcomes by analyzing how voters anticipate candidates addressing the issue regarded as most important. This simple model not only provides straightforward predictions but also carries decision-making implications. Political candidates can strategically respond to the forecast, shaping their campaigns based on two conceivable strategies: positioning themselves as the foremost candidate in handling the critical issue or actively influencing voters‘ perceptions about the issue’s significance.
Data
The model draws insights from two key poll categories:
- Issue Importance:
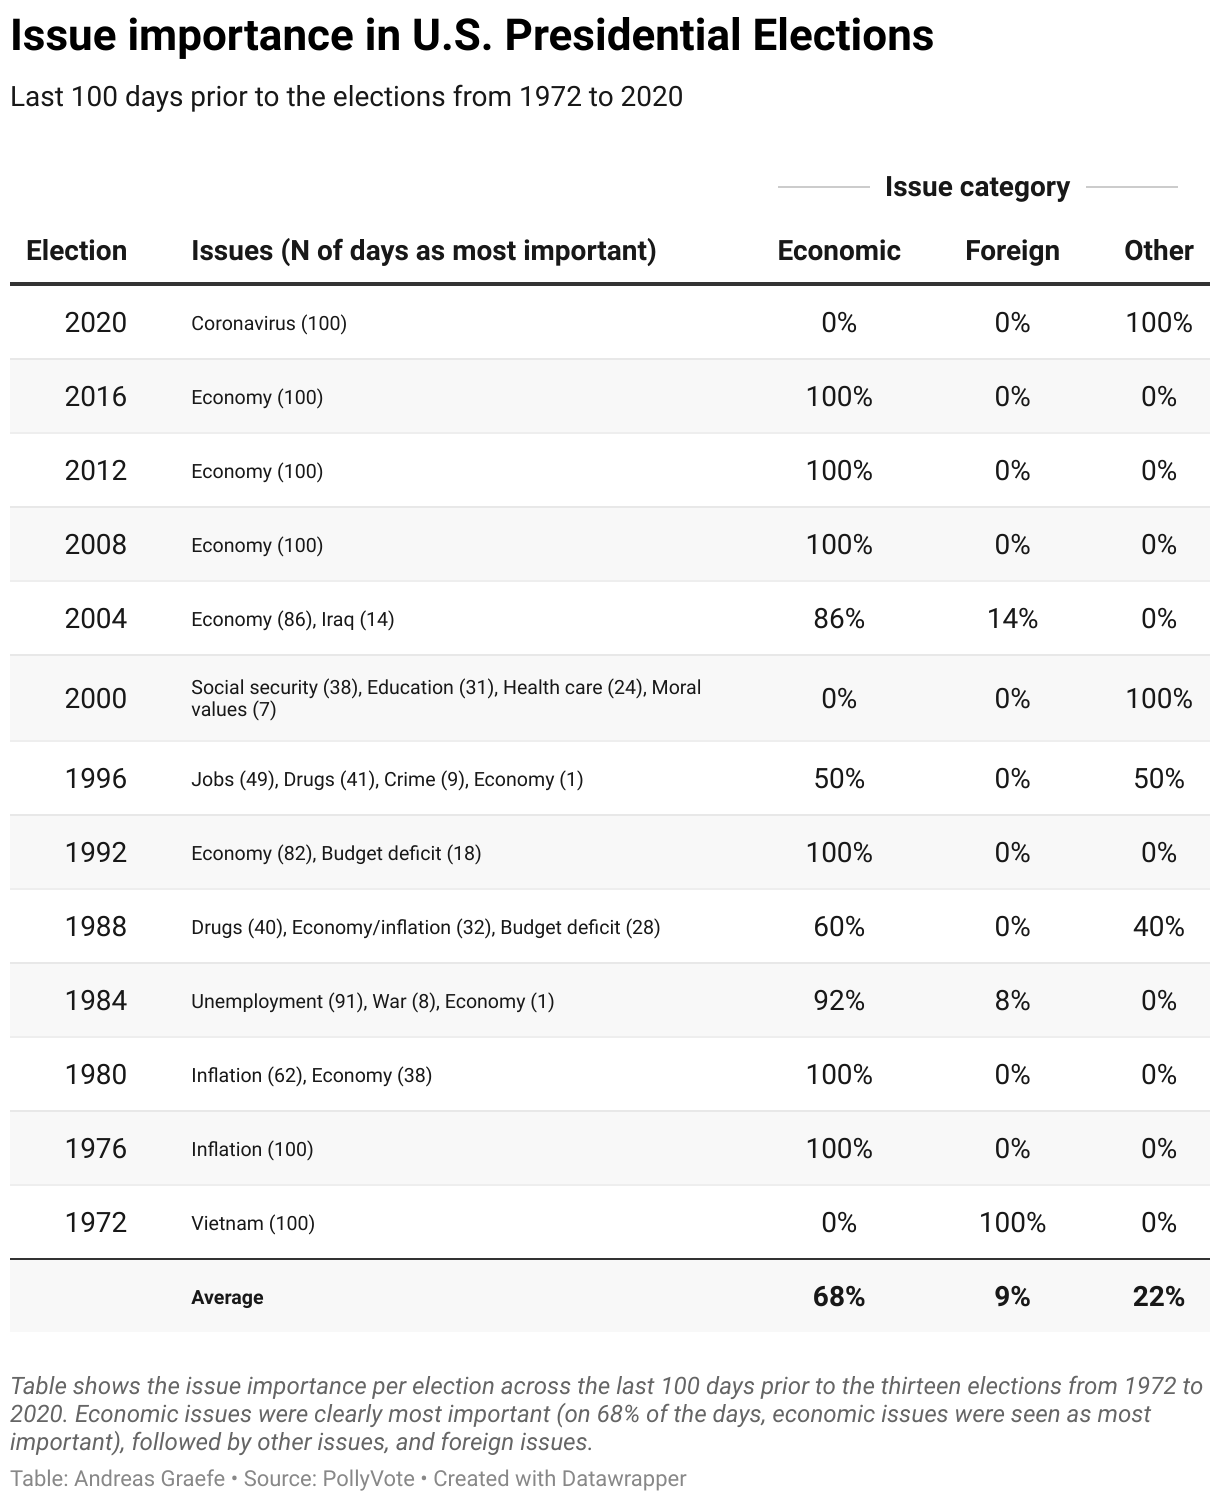
- The big-issue model uses issue importance polls to identify the issue voters regard as most important issue in a particular election.
- For forecasting the 2024 election, the big-issue model uses Gallup data to identify the most important issue in a particular election. The Gallup question is phrased as: „What do you think is the most important problem facing the country today?“
- Candidate Competence Polls:
- These polls inquire about respondents‘ perceptions of which candidate or party is better equipped to handle specific issues.
- For instance, questions like „Regardless of your 2016 presidential election candidate preference, do you believe Hillary Clinton or Donald Trump would better address issues like… the economy?“
- This data enriches the model by providing insights into voters‘ perceptions of candidates‘ competence on distinct issues, influencing their electoral choices.
U.S. Presidential elections 2012, 2016, 2020
Past performance
When the Big-issue model was first proposed, an ex post analysis for the ten elections from 1972 to 2008 showed that the model provided forecasts that were competitive compared to forecasts from econometric models and the Iowa Electronic Markets (IEM) prediction markets. An analysis of the model’s first ex ante forecasts for the 2012 election provided similar results. The big-issue model was again more accurate than the IEM and the typical econometric model.
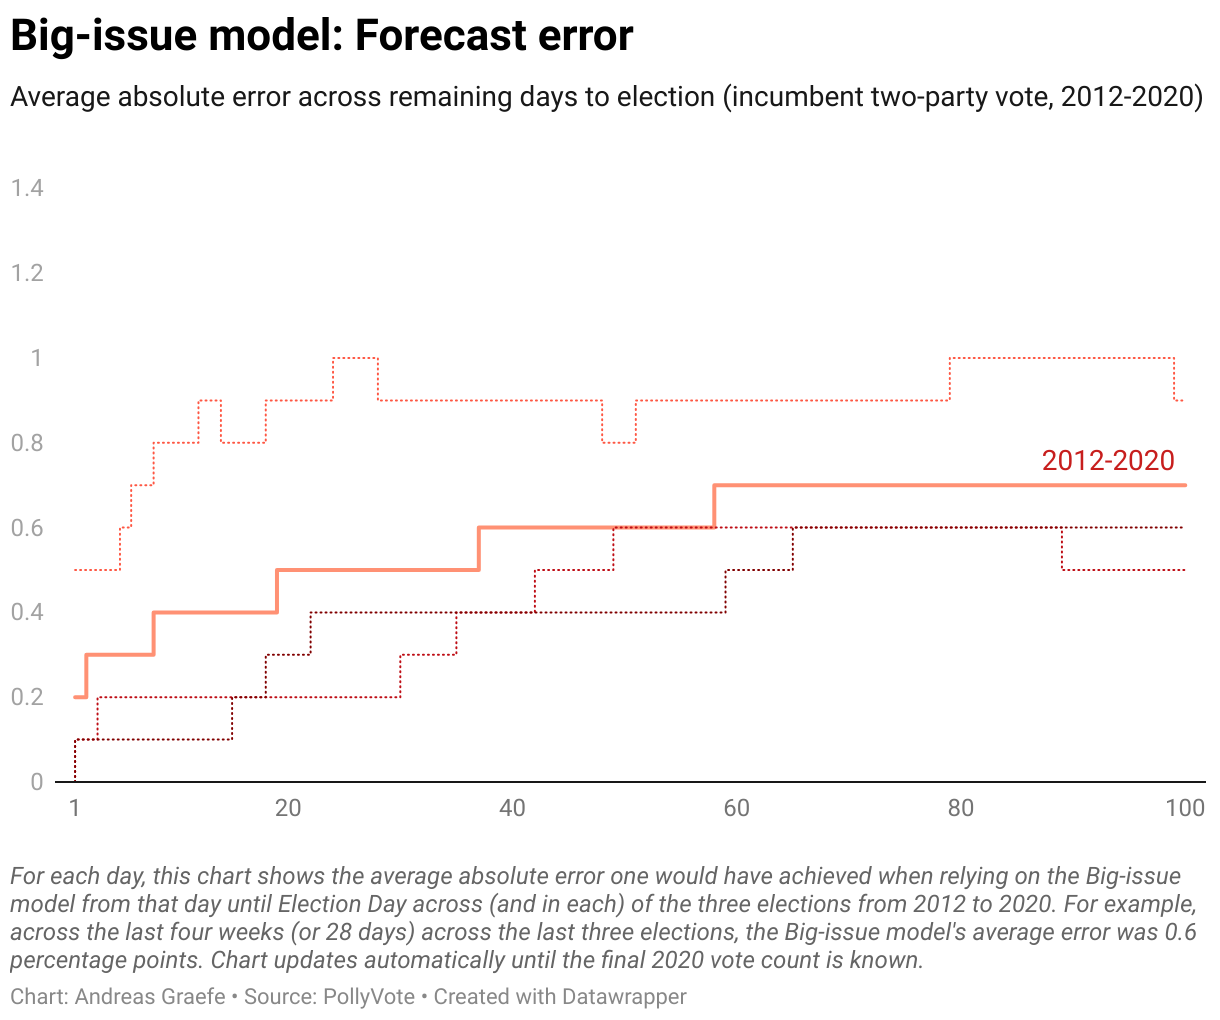
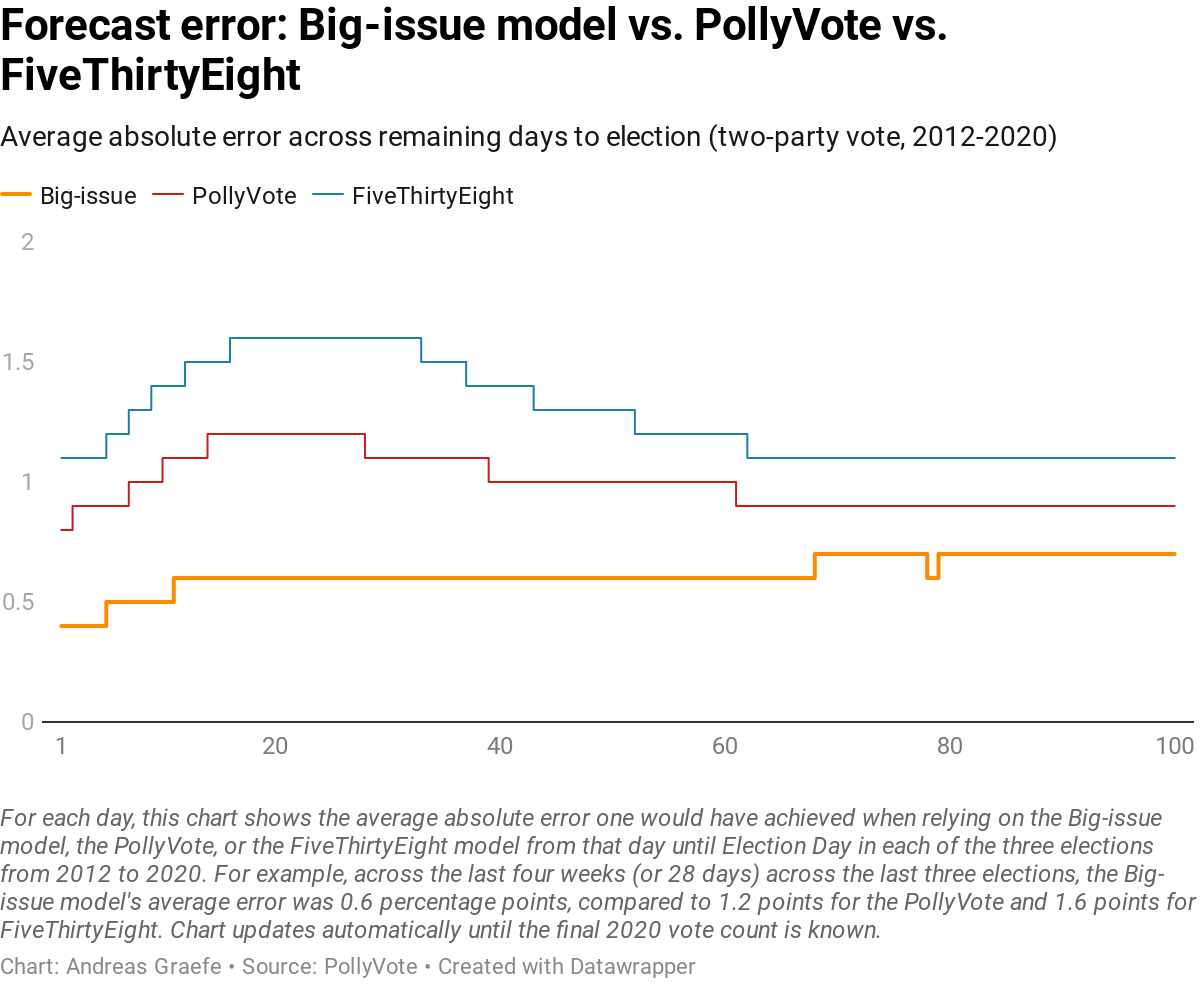
To this day, the model provided ex ante forecasts for the three elections from 2012 to 2020. The chart below shows the average absolute error one would have achieved when relying on the Big-issue model from each day until Election Day across (and in each) of the three elections from 2012 to 2020. For example, across the last four weeks (or 28 days) across the last three elections, the Big-issue model’s average error was 0.6 percentage points.
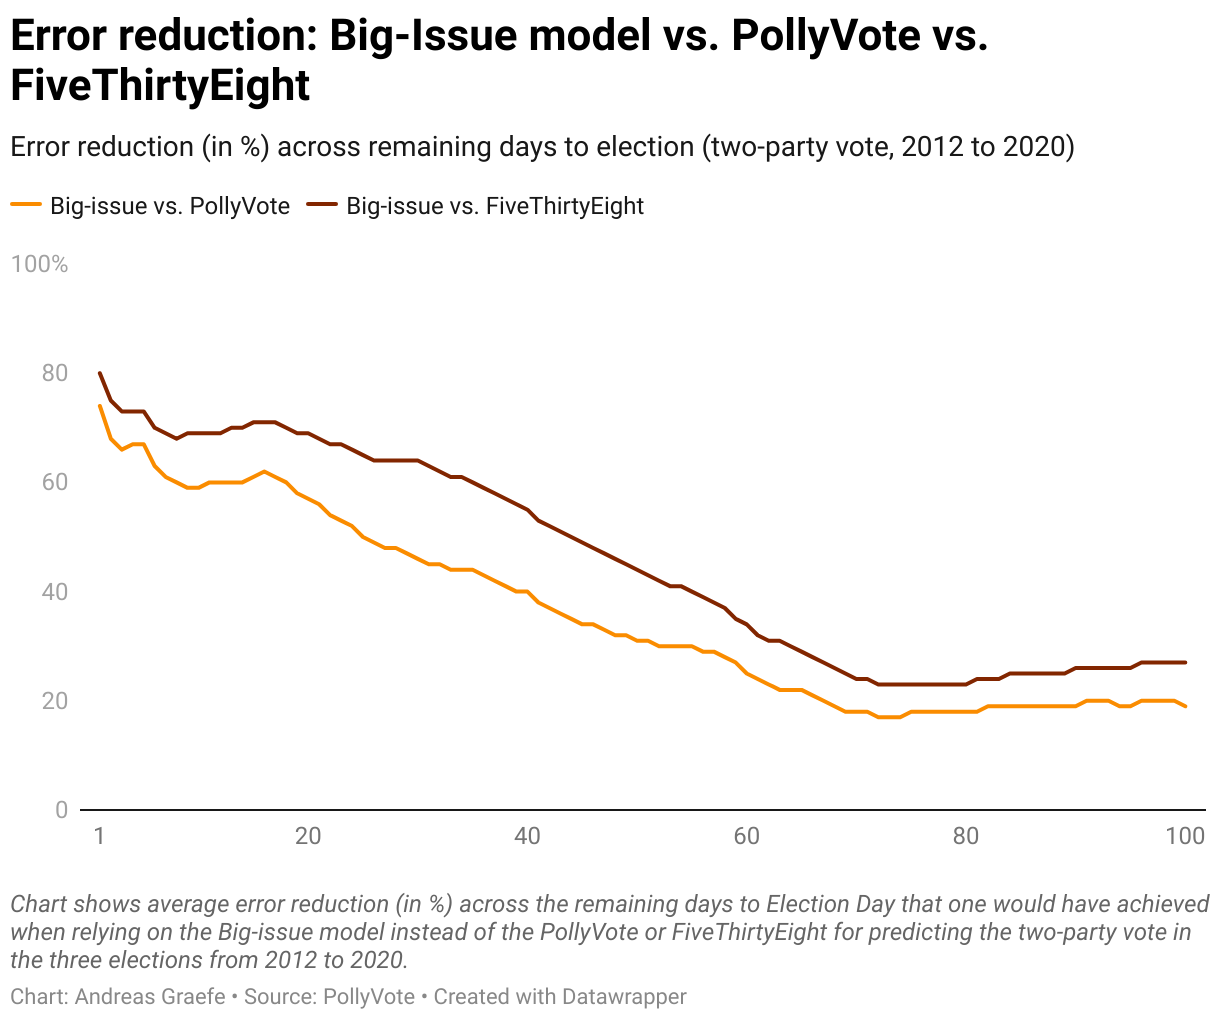
The forecasts of this simple model are highly accurate, especially when compared to benchmark approaches. Across the last 100 days before the three elections from 2012 to 2020, the Big-issue model would have consistently outperformed both the forecasts from the combined PollyVote and FiveThirtyEight. For example, assume that, four weeks (or 28 days) before the respective elections, you would have decided to rely on the Big-Issue model instead of the two benchmark forecasts. Then, you would have cut the forecast error of the PollyVote roughly in half. Compared to FiveThirtyEight, error reduction would habe been even higher, at 60%.